Civitavecchia – S. Marinella
Context
As part of the coal conversion project of the ENEL S.p.A. (Italian electricity company) a thermoelectric plant in Torrevaldaliga, north of Civitavecchia, the construction of some docks equipped for coal unloading was planned. These required the dredging of the bottoms in front of the plant and the consequent removal of a large portion, equal to one hectare of the Posidonia oceanica prairie in the Mattonara area (Site of Communitary Interest, SCI IT6000005), designated in 2016 as a Special Area of Conservation (SAC IT6000005), North of the port of Civitavecchia (RM) (central Tyrrhenian Sea). The activities of ENEL have been subjected to an Environmental Impact Assessment (EIA 6923/2002) and in the context of the relative EIA decree, the Ministry of the Environment and the Protection of the Territory and the Sea (MATTM) has prescribed a transplant of P. oceanica as a measure of compensation for damage to the prairie.
The transplant was carried out before the dredging activities, between August 2004 and March 2005, in areas identified as suitable within the current Special Conservation Area (SAC IT6000007) located between the municipality of S. Marinella and the inhabited area of S. Severa (Fig.1).
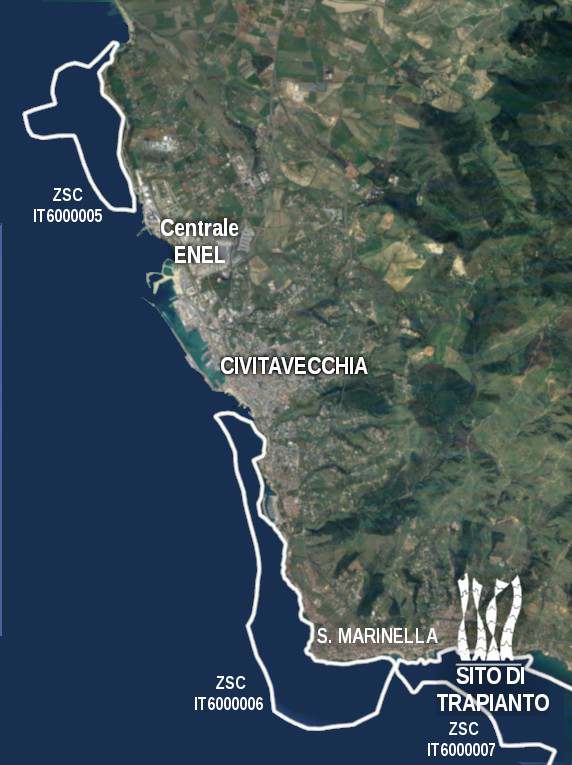
Figure 1 – Area affected by the transplant with the boundaries of the current Special Areas of Conservation (SAC IT6000007)
Transplant technique
To anchor the cuttings to the substrate, concrete frames of 50 × 50 cm were used (Fig. 2), with an internal lumen 40 × 40, for a useful surface of 1600 cm2. The thickness of the frames is 6-8 cm. Frames are reinforced with galvanized iron mesh with polygonal mesh suitable for holding the cuttings (about 1.5-2 cm). The cuttings are planted by hand in underwater immersion, simply by inserting the rhizomes in the meshes of the polygonal network, so that the rhizome is in contact with the sediment. The metal mesh used is sufficiently ductile to be shaped and firmly secure the cutting to the anchoring module. The technique was used on a sandy bottom.
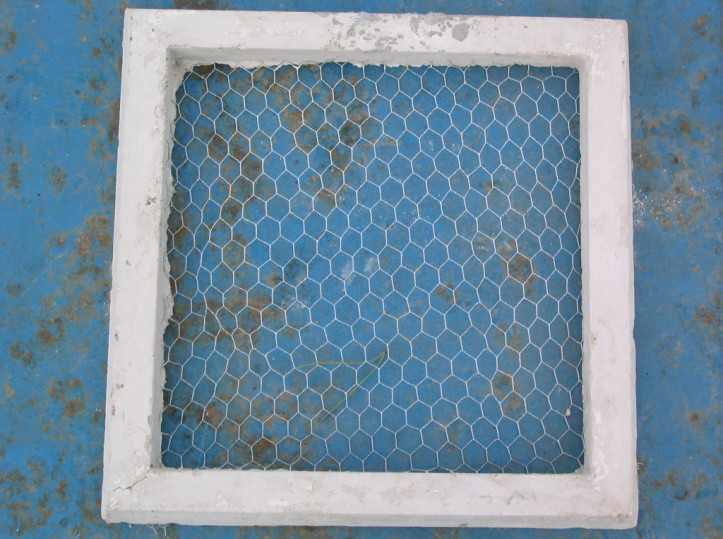
Figure 2 – Transplanting module used to anchor the cuttings .
Previous monitoring of the transplant in 2004-2005
Three months after the end of the cuttings transplant operations, the monitoring activities began, which initially lasted five years. The activities carried out during the monitoring phase were non-destructive and destructive. For the purpose of non-destructive monitoring, only in situ measurements were carried out, both for the transplantation areas and for the surrounding prairie. Four times a year, for five years, the following underwater measurements were carried out:
- count of residual cuttings and / or number of bundles per module
- determination of leaf growth through the method of Zieman (1974) as predicted by Ott (1980), with the exclusion of time 0, at which only the punching of the leaves is performed
- determination of the rank and length / width of the longest leaf
- determination of the state of the apexes and estimation of brown tissue
- qualitative evaluation of the epiphytic community of leaves
After the first 5 years (June 2005 – March 2010), monitoring was interrupted as prescribed in the Environmental Impact Assessment Decree (EIA 6923/2002), but since 2014 it has been resumed voluntarily by ENEL Produzione S.p.a. From 2014 to 2017, three monitoring campaigns were carried out, in continuity with the monitoring protocol described above, halving the sampling effort by about both in destructive monitoring and in investigations on the natural grassland. In Fig. 3 the phases of transplantation and subsequent monitoring are schematically represented.

Figure 3 -Timeline of the monitoring campaigns carried out on the Santa Marinella transplant site
Monitoring activities during LIFE SEPOSSO project
Between 25 and 29 June 2018 the SEPOSSO Partnership participated in the field activities on the transplant site of S. Marinella. The non-destructive monitoring was carried out on a subset of the monitoring stations at the S. Marinella site (Fig. 4) in order to compare the data with previous ones, considering the enormous extent of the transplant under study. These stations were identified on the basis of existing data, representing the different types of stations, from those in which the best transplant performance was achieved, to those with the worst performance (clearing stations 59, 70, 6 and 4). Two monitoring campaigns have been planned (Summer 2018 and Summer 2019). The following activities were performed:
activities 2018:
- count of number of bundles per module (in transplant stations)
- leaf density estimate (in control stations)
- determination of the rank and length / width of the longest leaf
- determination of the state of the apexes and estimation of brown tissue
- qualitative evaluation of the epiphytic community of leaves
- collection of bundles for lepidochronology on the transplant station and on natural grassland (on some selected stations)
- sampling of associated fauna by means of sorbonne on the transplant station and on natural grassland (on some selected stations)
- studies on the microdistribution of the beams on the transplant station and on natural grassland (on some selected stations)
activities 2019:
- estimate of leaf density in the patches present on transplanted bundles
- P. oceanica coverage estimates in transplant areas
- video-photographic investigations in the transplant areas aimed at creating photo-mosaics
- count the number of patches in the transplant areas and measure of the most representative patches
- count the number and measure of the length of the plagiotropic bundles at the edges of the transplant frame
collection of bundles for lepidochronology on the transplant station and on natural grassland (on some selected stations) - sampling of associated fauna by means of sorbonne (suction pipe) on the transplant station and on natural grassland (on some selected stations)
- studies on the microdistribution of the beams on the transplant station and on natural grassland (on some selected stations)

Figure 4 – Transplant clearings (blue) and monitoring stations (yellow).
Footage acquired on clearing “6” in year 2018